


Lesson3: Trend lines and pivot points
Trend Lines
Trend lines are probably the most common form of technical analysis. They are probably one of the most underutilized ones as well.
If drawn correctly, they can be as accurate as any other method.
Unfortunately, most traders don’t draw them correctly or try to make the line fit the market instead of the other way around.
In their most basic form, an uptrend line is drawn along the bottom of easily identifiable support areas (valleys).
In a downtrend, the trend line is drawn along the top of easily identifiable resistance areas (peaks).
How do you draw trend lines?
To draw trend lines properly, all you have to do is locate two major tops or bottoms and connect them.
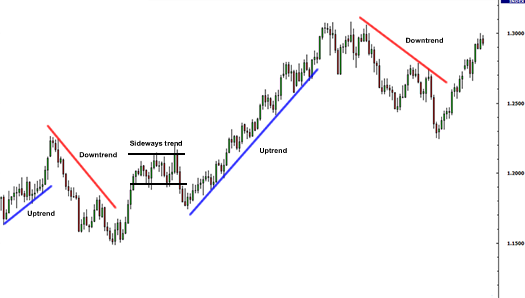
Types of Trends
There are three types of trends:
- Uptrend (higher lows)
- Downtrend (lower highs)
- Sideways trends (ranging)
Here are some important things to remember about trend lines:
- It takes at least two tops or bottoms to draw a valid trend line but it takes THREE to confirm a trend line.
- The STEEPER the trend line you draw, the less reliable it is going to be and the more likely it will break.
- Like horizontal support and resistance levels, trend lines become stronger the more times they are tested.
- And most importantly, DO NOT EVER draw trend lines by forcing them to fit the market. If they do not fit right, then that trend line isn’t a valid one!
Channels
If we take this trend line theory one step further and draw a parallel line at the same angle of the uptrend or downtrend, we will have created a channel. No, we’re not talking about ESPN, ABC, or Cartoon Network.
Still, this doesn’t mean that you should walk away like it’s a commercial break- channels can be just as exciting to watch as America’s Next Top Model or Entourage!
Channels are just another tool in technical analysis which can be used to determine good places to buy or sell.
Both the tops and bottoms of channels represent potential areas of support or resistance.
To create an up (ascending) channel, simply draw a parallel line at the same angle as an uptrend line and then move that line to position where it touches the most recent peak.
This should be done at the same time you create the trend line.
To create a down (descending) channel, simply draw a parallel line at the same angle as the downtrend line and then move that line to a position where it touches the most recent valley.
This should be done at the same time you create the trend line.
When prices hit the bottom trend line, this may be used as a buying area.
When prices hit the upper trend line, this may be used as a selling area.
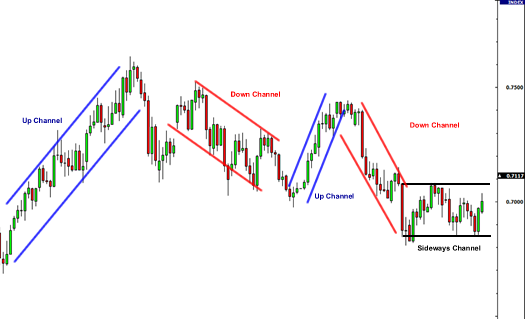
Types of channels
There are three types of channels:
- Ascending channel (higher highs and higher lows)
- Descending channel (lower highs and lower lows)
- Horizontal channel (ranging)
- Important things to remember about trend lines:
- When constructing a channel, both trend lines must be parallel to each other.
- Generally, the bottom of channel is considered a buy zone while the top of channel is considered a sell zone.
- Like in drawing trend lines, DO NOT EVER forces the price to the channels that you draw! A channel boundary that is sloping at one angle while the corresponding channel boundary is sloping at another is not correct and could lead to bad trades.
Pivot Points
Professional traders and market makers use pivot points to identify potential support and resistance levels.
Simply put, a pivot point and its support/resistance levels are areas at which the direction of price movement can possibly change.
The reason why pivot points are so enticing?
It’s because they are OBJECTIVE.
Unlike some of the other indicators that we’ve taught you about already, there’s no discretion involved.
In many ways, pivot points are very similar to Fibonacci levels.
Because so many people are looking at those levels, they almost become self-fulfilling.
The major difference between the two is that with Fibonacci, there is still some subjectivity involved in picking Swing Highs and Swing Lows.
With pivot points, traders typically use the same method for calculating them.
Many traders keep an eye on these levels and you should too.
Pivot points are especially useful to short-term traders who are looking to take advantage of small price movements.
Just like normal support and resistance levels, traders can choose to trade the bounce or the break of these levels.
Range-bound traders use pivot points to identify reversal points.
They see pivot points as areas where they can place their buy or sell orders.
Breakout traders use pivot points to recognize key levels that need to be broken for a move to be classified as a real deal breakout.
Here is an example of pivot points plotted on a 1-hour EUR/USD chart:
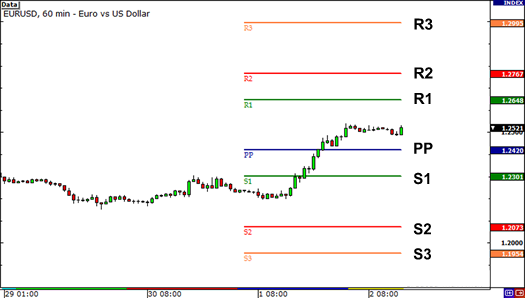
As you can see here, horizontal support and resistance levels are placed on your chart. And look – they’re marked out nicely for you! How convenient is that?!
Here’s quick rundown on what those acronyms mean:
PP stands for Pivot Point.
S stands for Support.
R stands for Resistance.
But don’t get too caught up in thinking “S1 has to be support” or “R1 has to be resistance.” We’ll explain why later.
In the following lessons, you will learn how to calculate pivot points, the different types of pivot points and most importantly, how you can add pivot.