Indicators
Impulse MACD:
The basis of the indicator is constructing a system combining three moving avarges.
Visual presentation and physical sense can be estimated when attaching them to a chart.
The first indicator: SMMA МА of High
The second indicator: SMMA МА of Low
These lines constitute a channel.
The third indicator: LWMA МА of WEIGHTED. Actually this is an impulse signal line. Here is nothing new, but the histogram construction method differs from traditional.
The main question that the indicators will answer is why do we always need to track MACD values and its movements even if they are useless at the moment? The solution is to remove from a chart all unnecessary values. This is done by analyzing the position of an impulse.
Signal line relatively to the channel lines: if the impulse line is higher than High value, divergence is calculated as the difference between the impulse and the High value. If it is lower than Low, it is calculated as the difference between the impulse and Low. Consequently, intermediary movements are not shown.
And there is additional signal line of a histogram typical of MACD.
A trading system here is clear from the chart: open only when the histogram and the zero line signal cross, if direction changes place a trailing stop and wait for the next intersection if a Stop triggers. So, we use only the first price movement impulse.
Conclusion: you can open a sell position when the line crosses below the zero line.
You can open a buy position when the line crosses above the zero line.
SHI Channel true:
Indicator SHI_Channel_true shows Barishpolts dynamic moving channels in the chart in automated mode.
The indicator finds the nearest (in terms of time) fractal in history, searches for the next one, and connects them with a line. Then it draws a parallel line on the maximal fractal on the opposite side. Then it draws a midline between these two lines.
Parameters (in brackets – the default value of the parameter): BarsForFract(0) – Length of the fractal “arm”.
A classical fractal consists of five bars: an extreme and two bars (“arm” is equal to 2) by each side. However, the length of the “arm” can be increased. If the parameter is 0, the length of the “arm” depends on the chart time interval and is determined by the program automatically.
The indicator works on all currency pairs and on all timeframes starting with М1. The indicator calculates the channels by using a very sophisticated algorithm. An example for a buy position is if you have a downtrend channel you can open a sell. Position in his resistance line and buy position in his support.
An example for a sell position is - if you have an uptrend channel you can open a sell Position with its resistance line and buy position with its support.
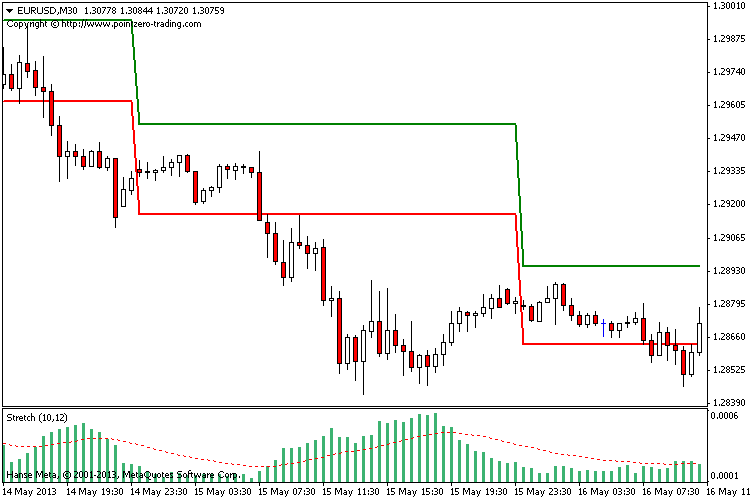
Stretch Breakout Channel:
What is the Stretch?
The Stretch is calculated by taking the 10 period SMA of the absolute difference between the open and either the high or low, whichever difference is smaller. It represents the minimum average price movement/deviation from the open price during a period of time, and that value is used to calculate a breakout threshold for the current trading session. This can be used to plot a multi time frame breakout channel.
The Opening Range Breakout (ORB) Trading Strategy
Using this strategy, the trader places a buy stop just above the open price plus the Stretch and a sell stop just below the open price minus the Stretch. The first stop triggered enters the trader into the trade and the other stop becomes the protective stop.
Crabel’s research shows that the earlier in the trading session the entry stop is hit the more likely the trade will be profitable at the close. A market movement that kicks off a trend quickly in the current trading session could add significant profit to a trader’s position by the close and should be considered for a multi-day trade.
Extending Crabel’s research results it is obvious that as time passes and we are not filled early on then the risk increases and it becomes prudent to reduce the size of the position during the day. Trades filled towards the end of the day carry the most risk and the later in the day the trade is filled the less likely the trader will want to carry that trade overnight.
Opening Range Breakout Preference (ORBP) Trading Strategy
An ORBP trade is a one sided Opening Range Breakout (ORB) trade. If other technical indicators show a strong trend in one direction then the trader will exercise a preference for the direction in which to trade the ORB trade. A stop to open a position would be placed on the side of the trend only and if filled a protective stop would then be placed. The calculation of where to place the “stop to open” would be the same as that for the ORB trade: For longs, the Open price plus the Stretch and for shorts the Open price minus the Stretch.
Variation Index:
The most popular representatives of the fractal time functions are the financial time series. The fractal structure of these series is well-known and According to Mandelbrot there is a rewording of the famous market saying that the movement of stocks and currencies is independent of the time scale and the Price.
An observer can’t tell if the information refers to the weekly, daily or hourly changes just by looking at the appearance of the chart.
Usually, to determine the fractal dimension the Hurst’s exponent is calculated. However, for the reliable calculation of this exponent a huge amount of data Is necessary (~ 10^3) and that is too much comparing to the duration of the trends of trading.
The authors interpose the fractal characteristics – the variation index (m) that is closely related to the common fractal dimension. In distinct from the Hurst’s exponent, the amount of information that is necessary for index determination is less by a factor of 2. It leads to use it as local characteristics for determination of the dynamics of the price series. If m < 0.5, it can be interpreted as a trend and m > 0.5 – as a flat.
The suggested indicator calculates the variation index on a previous interval which is 2^n long. The “n” parameter is specified by the user.
The common rules of the indicator application are the following:
- If the value of the indicator is lower than 0.5 it means the trend state of the market.
- The extremely low value is often precedes the end (correction) of the current trend.
- If the value of the indicator is higher than 0.5 it means the flat state of the market.
- The extremely high value is often precedes the beginning of the considerable trends.
- If the value of the indicator is close to 0.5 it means an undefined state of the market.
ZeroLag MACD
The Indicator ZeroLag MACD is an indicator Moving Average Convergence/Divergence, MACD with zero delay.
The Indicator ZeroLag MACD in contrast with standard MACD gives the signals on several bars earlier, but divergences/convergence denominated more obviously.
ZeroLAG MACD calculates on formula:
ZeroLAG MACD(i) = (2*EMA(Close, FP, i) – EMA(EMA(Close, FP, i), FP, i)) – (2*EMA(Close, SP, i) – EMA(EMA(Close, SP, i), SP, i));
ZeroLAG MACD Signal(i) = 2*EMA(ZeroLAG MACD(i), SigP, i) – EMA(EMA(ZeroLAG MACD(i), SigP, i), SigP, i);
where:
EMA – exponential moving average;
Close – a price of the closing of the bar;
FP – a period of the quick moving average;
SP – a period of the slow moving average;
SigP – a period of the signal moving average;