


Lesson 5:moving average
Moving Average
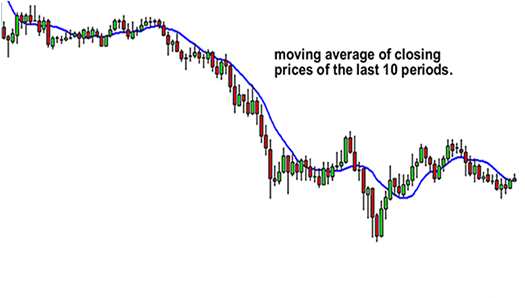
A moving average is simply a way to smooth out price action over time.
By “moving average”, we mean that you are taking the average closing price of a currency pair for the last ‘X’ number of periods.
On a chart, it would look like this:
Like every indicator, a moving average indicator is used to help us forecast future prices.
By looking at the slope of the moving average, you can better determine the potential direction of market prices.
As we said, moving averages smooth out price action.
There are different types of moving averages and each of them has their own level of “smoothness”.
Generally, the smoother the moving average, the slower it is to react to the price movement.
The choppier the moving average, the quicker it is to react to the price movement.
To make a moving average smoother, you should get the average closing prices over a longer time period.
Now, you’re probably thinking, “C’mon, let’s get to the good stuff. How can I use this to trade?”
In this section, we first need to explain to you the two major types of moving averages:
- Simple
- Exponential
We’ll also teach you how to calculate them and give the pros and cons of each.
You need to know the basics first!
Exponential Moving Average
As we said in the previous lesson, simple moving averages can be distorted by spikes.
We’ll start with an example.
Let’s say we plot a 5-period SMA on the daily chart of EUR/USD.
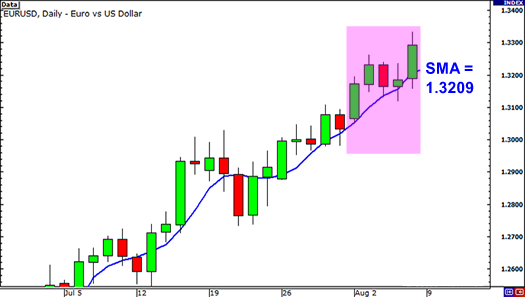
The closing prices for the last 5 days are as follows:
Day 1: 1.3172
Day 2: 1.3231
Day 3: 1.3164
Day 4: 1.3186
Day 5: 1.3293
The simple moving average would be calculated as follows:
(1.3172 + 1.3231 + 1.3164 + 1.3186 + 1.3293) / 5 = 1.3209
Simple enough, right?
Well what if there was a news report on Day 2 that causes the euro to drop across the board. This causes EUR/USD to plunge and close at 1.3000.
Let’s see what effect this would have on the 5 period SMA.
Day 1: 1.3172
Day 2: 1.3000
Day 3: 1.3164
Day 4: 1.3186
Day 5: 1.3293
The simple moving average would be calculated as follows:
(1.3172 + 1.3000 + 1.3164 + 1.3186 + 1.3293) / 5 = 1.3163
The result of the simple moving average would be a lot lower and it would give you the notion that the price was actually going down, when in reality, Day 2 was just a one-time event caused by the poor results of an economic report.
The point we’re trying to make is that sometimes the simple moving average might be too simple.
If only there was a way that you could filter out these spikes so that you wouldn’t get the wrong idea. Hmm… Wait a minute… Yep, there is a way!
It’s called the Exponential Moving Average!
Exponential moving averages (EMA) give more weight to the most recent periods.
In our example above, the EMA would put more weight on the prices of the most recent days, which would be Days 3, 4, and 5.
This would mean that the spike on Day 2 would be of lesser value and wouldn’t have as big an effect on the moving average as it would if we had calculated for a simple moving average.
If you think about it, this makes a lot of sense because what this does is it puts more emphasis on what traders are doing recently.
Let’s take a look at the 4-hour chart of USD/JPY to highlight how an SMA and EMA would look side by side on a chart.
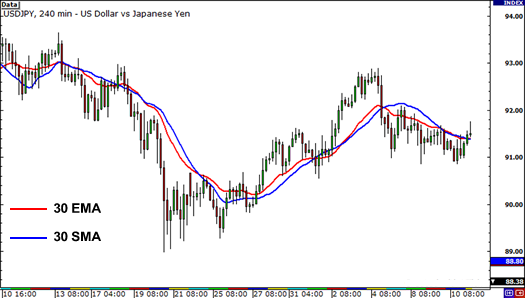
Notice how the red line (the 30 EMA) seems to be closer price than the blue line (the 30 SMA).
This means that it more accurately represents recent price action. You can probably guess why this happens.
It’s because the EMA places more emphasis on what has been happening lately.
When trading, it is far more important to see what traders are doing NOW rather what they were doing last week or last month.
Using Moving Averages
One sweet way to use moving averages is to help you determine the trend.
The simplest way is to just plot a single moving average on the chart.
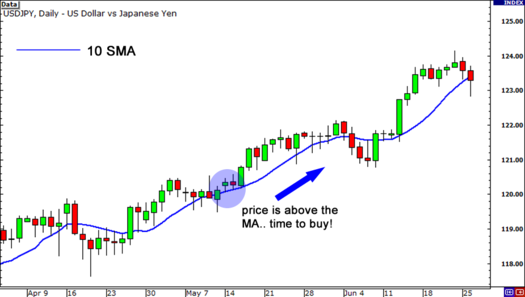
When price action tends to stay above the moving average, it would signal that price is in a general uptrend.
If price action tends to stay below the moving average, then it would indicate that it is in a downtrend.
The problem with this is that it’s too simplistic.
Let’s say that USD/JPY has been in a downtrend, but a news report comes out causing it surge higher.
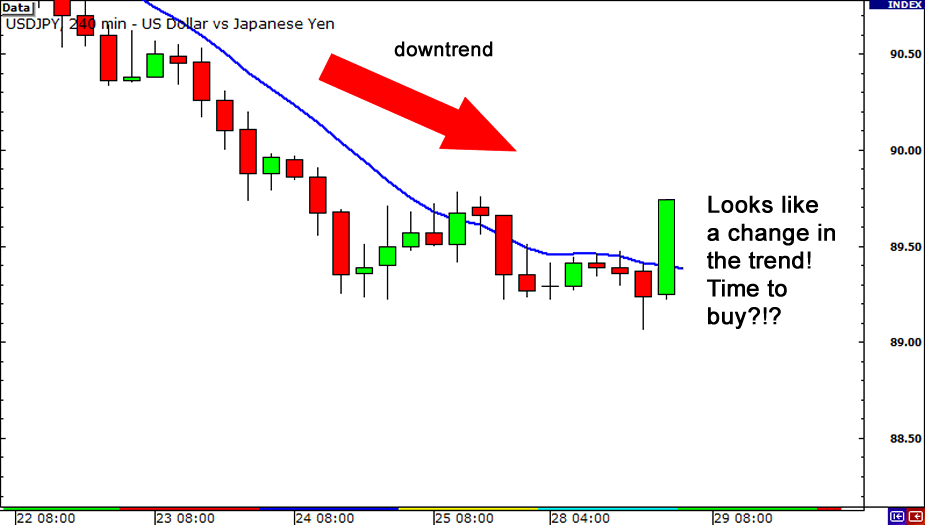
You see that the price is now above the moving average. You think to yourself:
“Hmmm… It looks like this pair is about to shift direction. Time to buy this sucker!”
So you do just that. You buy a billion units cause you’re confident that USD/JPY is going to rise.
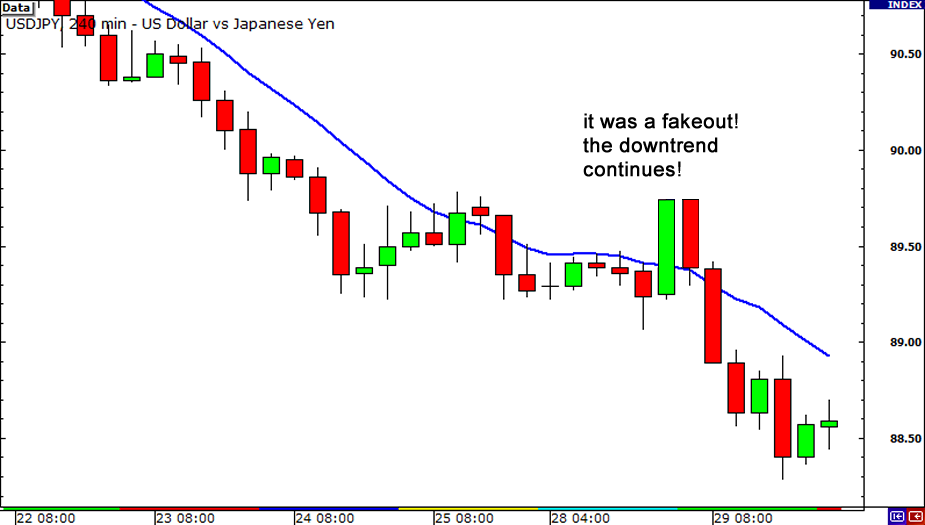
Bammm! You got faked out! As it turns out, traders just reacted to the news but the trend continued and price kept heading lower!
What some traders do – and what we suggest you do as well – is that they plot a couple of moving averages on their charts instead of just one.
This gives them a clearer signal of whether the pair is trending up or down depending on the order of the moving averages.
Let us explain.
In an uptrend, the “faster” moving average should be above the “slower” moving average and for a downtrend, vice versa.
For example, let’s say we have two MAs: the 10-period MA and the 20-period MA. On your chart, it would look like this:
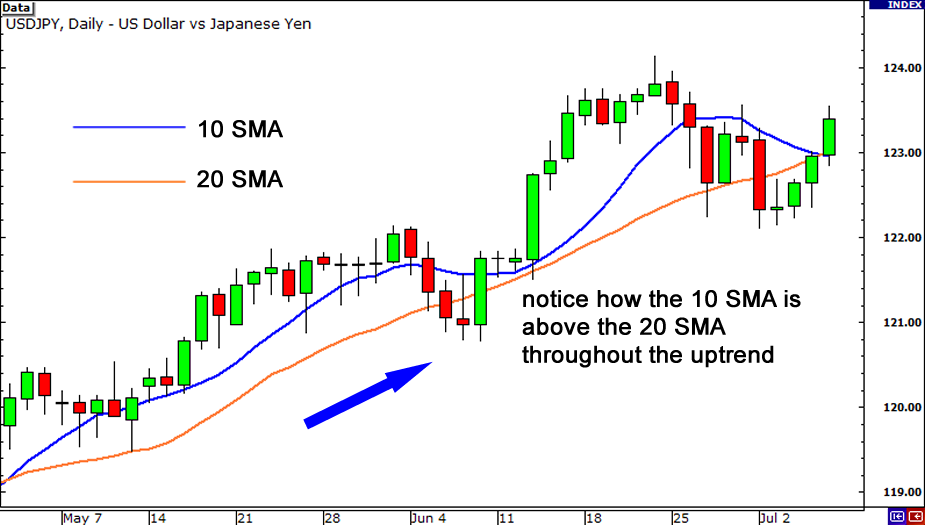
Above is a daily chart of USD/JPY.
Throughout the uptrend, the 10 SMA is above the 20 SMA.
As you can see, you can use moving averages to help show whether a pair is trending up or down.
Combining this with your knowledge on trend lines, this can help you decide whether to go long or short a currency.
You can also try putting more than two moving averages on your chart.
Just as long as lines are in order (fastest to slowest in an uptrend, slowest to fastest in an downtrend), then you can tell whether the pair is in an uptrend or in a downtrend.